Instructions for Use
For technical help, please contact Podimetrics.
1-888-498-6489 info@podimetrics.com
All names in these instructions are pseudonyms and do not refer to any individual or patient.
Getting Started
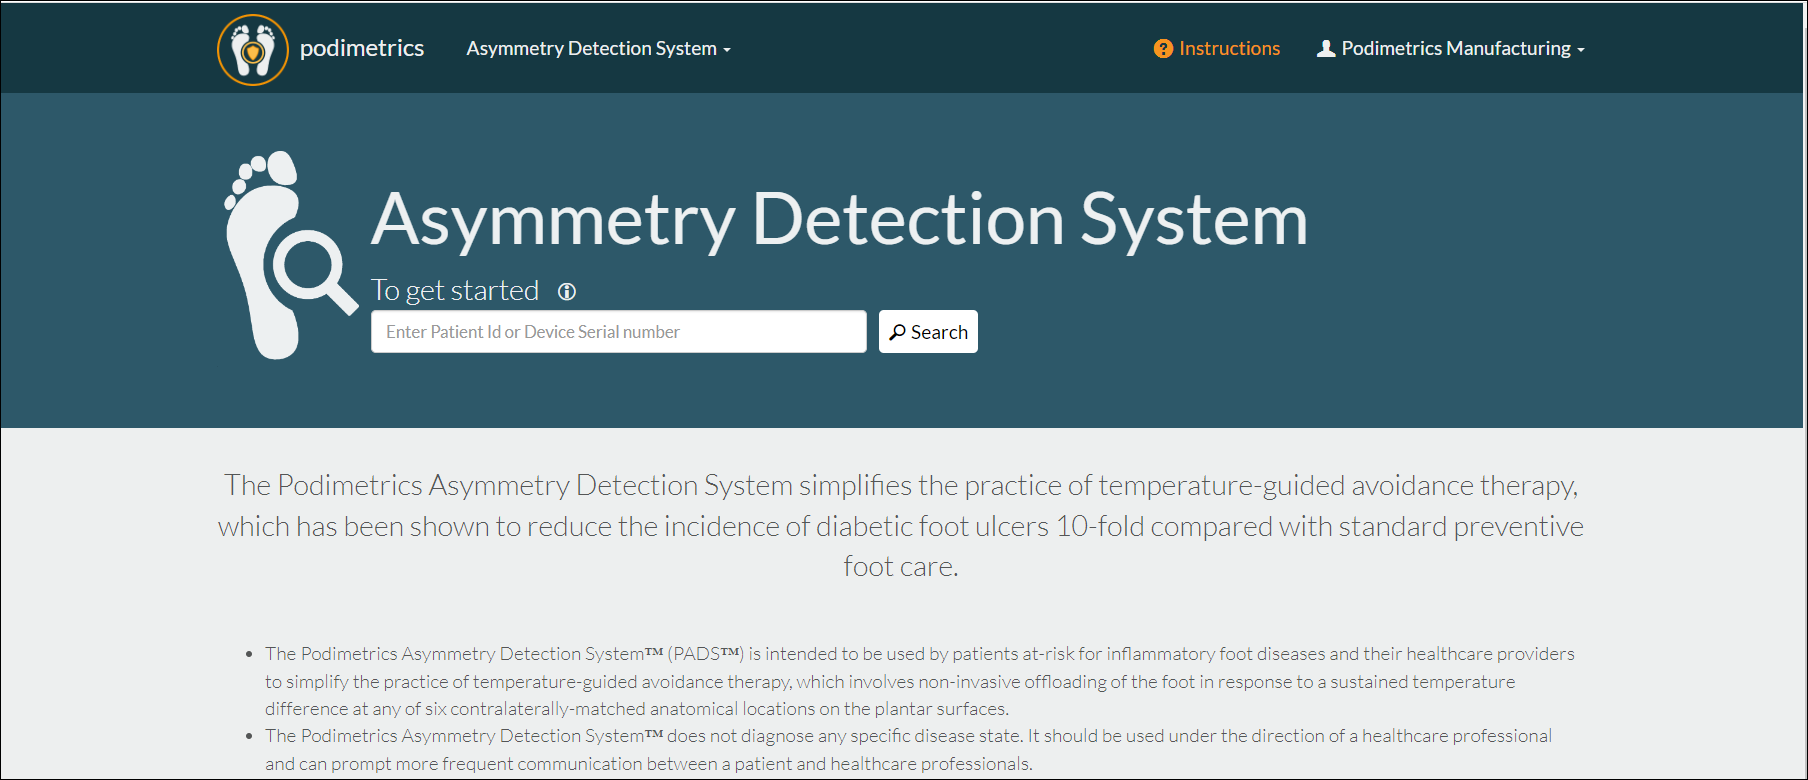
Welcome to the Podimetrics Asymmetry Detection System™. The Asymmetry Detection System™, or PADS™ for short, helps you to identify signs of inflammation on the soles of the feet. After logging in, users can search by Patient ID or Device Serial Number. Enter at least two characters for a Patient ID and select the patient from the search results. Enter the full Device Serial Number and it will bring up the exact patient. Click the Information icon after “To get started” for help with entering the search criteria. Click the Instructions button in the banner for help in using PADS™. If you expected to see a patient in the list but don't, please contact Podimetrics.
Page Overview
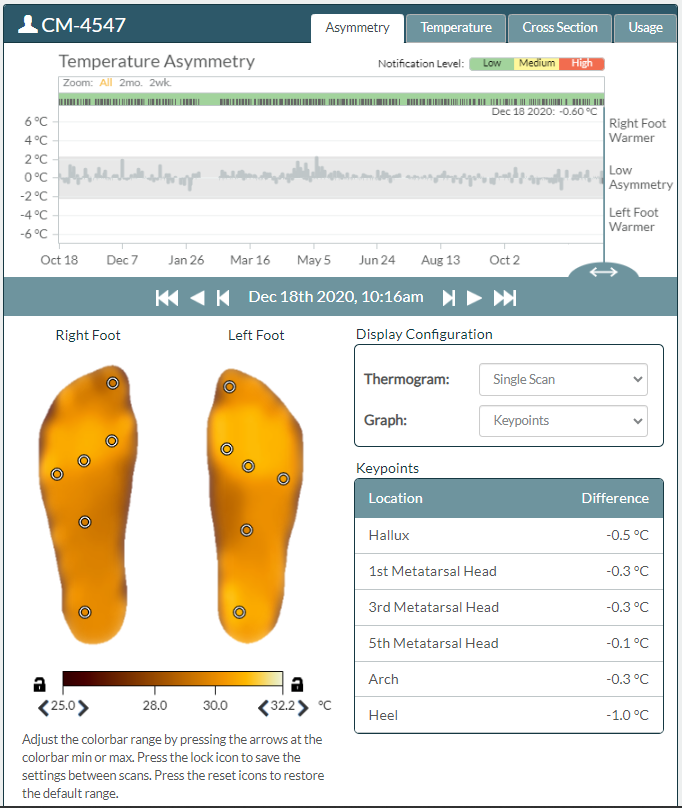
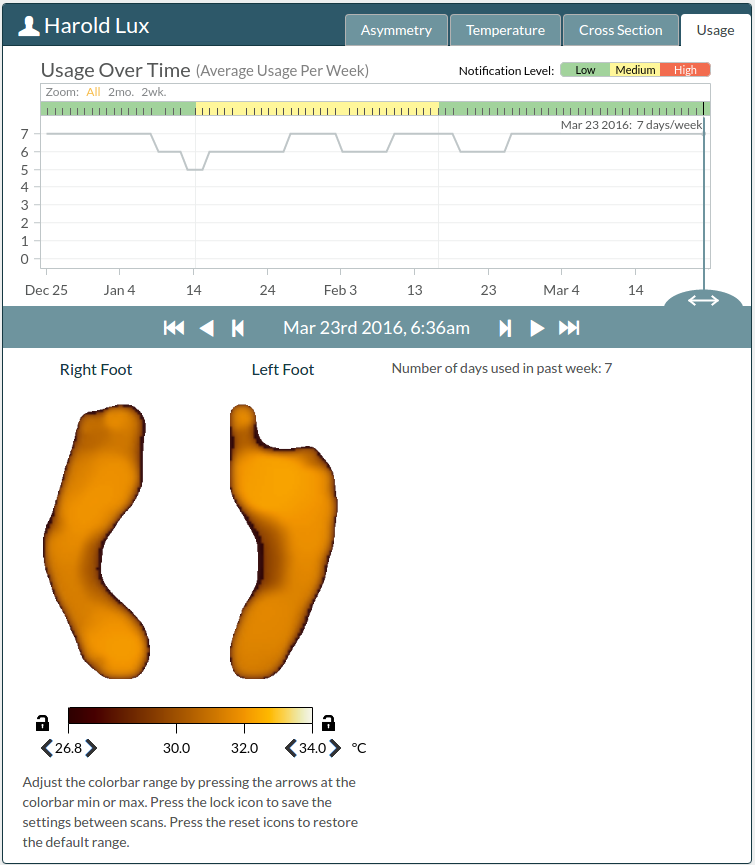
Upon selecting a patient on the splash page, you will be taken to the dashboard. If the patient is bilateral, then you will see a thermogram image showing both feet:
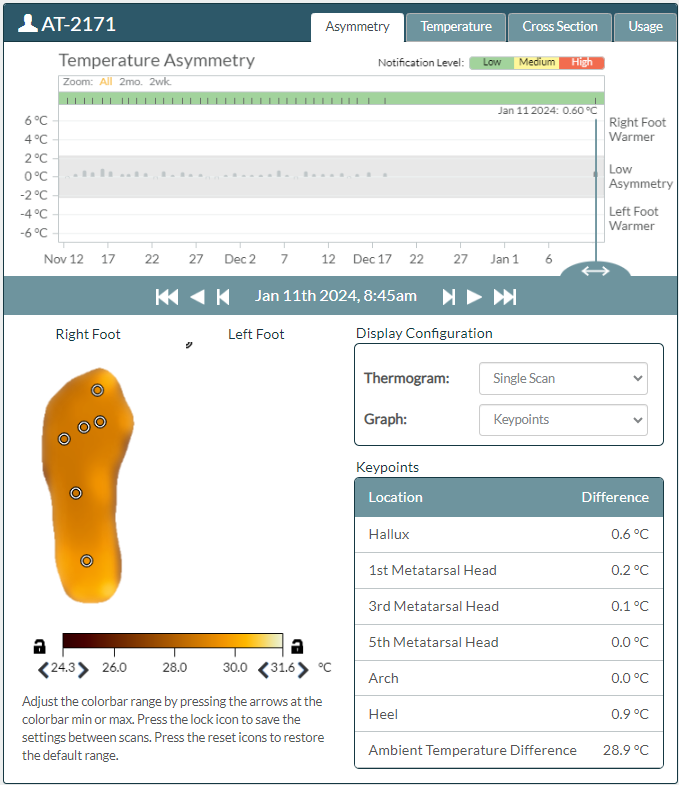
If the patient is “single foot,” then you will see a thermogram image with the single foot:
This page is split up into three sections.
- The left panel on this page contains a list of all patients associated with your account.
-
The right panel is specific split into two sections:
- The top section graphs information from the selected patients scan history.
- The bottom section displays the currently selected thermogram, which was taken at the time of the date in the center.
Selecting Patients
The patients table, located on the left hand side of the page, can be used to view and select patients.
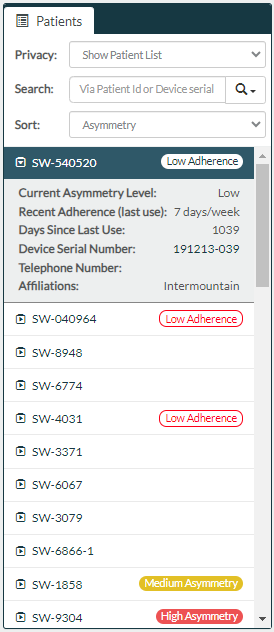
Clicking a patient in this table will select that patient and update the right panel. When a patient is selected, their row in this table is expanded to display their Current Asymmetry Level, Adherence, Device Serial Number, and Telephone Number. Click on the arrows next to each patient name to toggle whether a row is expanded or collapsed.
To hide all patient information except the currently-selected patient for privacy purposes, click the Privacy dropdown and select Hide Patient List. To return to showing all patients, select Show Patient List.
Click the Search dropdown.
For Search Type, select Patient Id, Serial Number, or Affiliation.- To search by Patient Id, enter at least the first two characters.
- To search by Serial Number, enter the full 10- or 15-digit number.
- To search by Affiliation, enter provider name. Add location, such as "VA Houston," for a more specific search and quicker response.
Note: You can type in the Patient Id or Serial Number and either press Enter or use the dropdown and select either of those options. For Affiliation searches, type your search entry and then use the dropdown to select Affiliation.
Click the Sort dropdown and select from the following options:
- Last name.
- Adherence.
- Asymmetry.
Selecting Scans
PADS™ can display thermograms from any time a patient used the Podimetrics Mat. This can help you determine if there have been any changes to the patient's feet over time.
The current date, pictured here, is shown at the center of the right side of the page.

There are three buttons to each side of the date, each of which can be used to change the currently selected thermogram.
- The first button will change the currently selected thermogram to the first scan taken by the selected patient. Similarly, the last button will change the currently selected thermogram to the latest scan taken.
- The middle buttons are referred to as the play buttons. They will, starting from the currently selected scan, animate through each scan taken until you've reached either the first scan taken or last scan taken, depending on which direction you clicked. In other words, these buttons will change the currently displayed thermogram about once every 600 milliseconds to the next thermogram in line to be viewed, creating an animation like effect.
- The buttons closest to the date in the center increment the currently selected scan by one, so that you're navigating to the previous / next scan taken.
The graph displayed at the top of the page can also be used to change the currently selected thermogram.
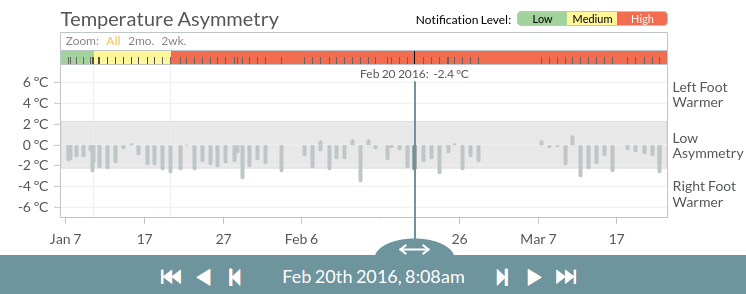
Each data point on the graph represents a scan which was taken by the selected patient. The vertical bar with a date above it is displaying the location of the currently selected scan. One can click anywhere on this graph in order to change the currently selected thermogram. Alternatively, one can click and drag the bar to change the currently selected thermogram.
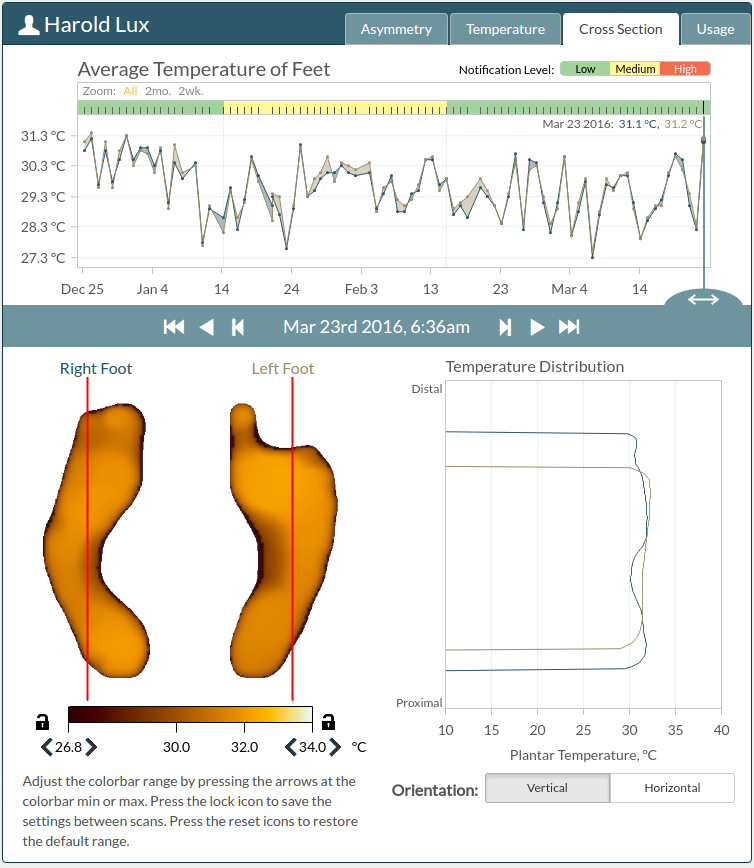
Using the Colorbar
The colorbar is used to control how color on the thermogram relates to temperature on the foot. The colorbar is shown beneath the thermogram.
The colorbar limits are the minimum and maximum temperatures corresponding to the colors at the extreme ends of the colorbar. By default, when a thermogram is displayed, the colorbar limits are set to the minimum and maximum temperature on the thermogram. These temperature limits can each be adjusted on the colorbar using the left and right arrows below the minimum and maximum temperatures. These arrows are located at the extreme left and right below the colorbar (look for the and icons).
When one of the colorbar limits is changed from the default temperature, a refresh button appears (look for the icon). This can be used to set the colorbar limit to its default value.
Sometimes, it can be useful to compare thermograms with the minimum and/or maximum temperatures set to a static temperature instead of having the limits default to the minimum and maximum thermogram temperature. The colorbar limits can be kept the same across different thermograms using the temperature lock button at the extreme left and right of the colorbar.
When the colorbar limits are not locked, the button is shown. Clicking this button locks the colorbar limit and changes the icon to . When a colorbar limit is locked, it will not be set to the default value when viewing another thermogram.
Analysis Modules
The top right of the screen contains a series of tabs which are used to change the information displayed on the graph. Additionally, some tabs provide tools intended to help analyze the currently selected thermogram, which we will outline in detail in the section below.
 PADS™ contains four such tabs.
Asymmetry
The asymmetry tab allows users to interact with the thermograms to measure and compare temperatures at different locations on the feet.
In the Asymmetry tab, a comparison point circle is appended to each foot. To the right of the thermogram is a section labeled "Point Comparison", which displays the temperature value at the location of each comparison point. These comparison points can be moved around by either clicking on any point on the thermogram, or clicking and dragging a comparison point to a new location.
Comparison points will mirror each other by default, so that any change in location on one point will result in the other point moving to its mirror position. This can be toggled on / off by clicking on the "Unmirror" button in the "Point Comparison" section.
In the Asymmetry tab, the graph displays the temperature difference over time between the right and left feet at the current location of the comparison points.
In the Display Configuration section, there are two options:
- Select "Single Scan" to view one thermogram at a time, or select "7 Day Avg" to view a thermogram that has been created from the averaging of the selected scan and those from the 6 prior days.
- Select "Selected Points" to display one pair of comparison points, or select "Keypoints" to display several comparison points corresponding to common areas of interest on the thermogram. For each keypoint, the application will attempt to find the location on the scan most suitable to that anatomical site. If scan does not include that anatomical site (due to amputation for example), a location on the scan close to that site will be selected. The keypoints can be moved by clicking and dragging or disabled by clicking “Disable”.

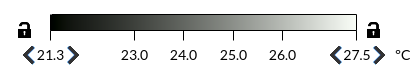
Temperature
The temperature tab displays information to help gain a better understanding of how temperature is distributed for the currently selected thermogram.
The timeline graph will automatically show the actual temperature for each foot at the selected point. The shaded region between the lines will be brown if the left foot is warmer and blue if the right foot is warmer at that location.
In the Display Configuration section, there are three options:
- The "Selected" option graphs the actual temperature over time at the comparison points.
- The "Average" option removes the comparison points from the thermogram, and displays a graph of the average temperature of the feet over time.
- The "Max" option graphs the maximum temperature over time, and displays the location of the maximum temperature on the currently selected scan.
Below the Display Configuration section is a histogram showing the temperature distribution for each foot of the current scan.
Below the histogram is a table containing the Mean, Median, and Max temperature values for each foot.
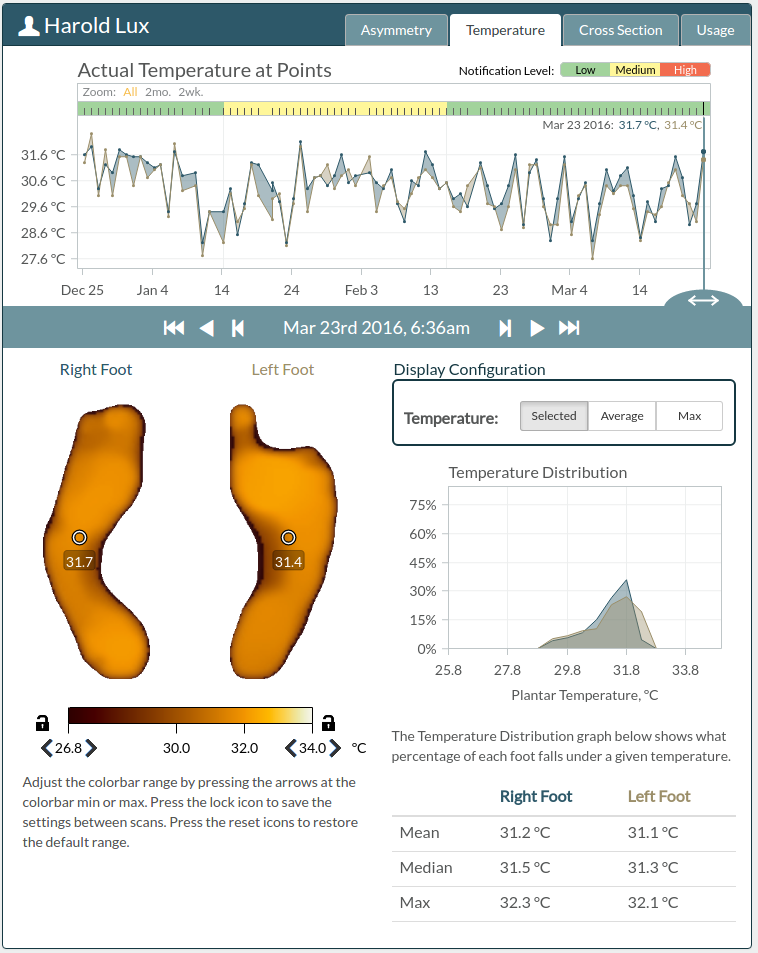
Cross Section
The cross section tab shows either a vertical or horizontal line on the thermograms, with a graph to the right of the thermograms displaying the temperature at each point along this line. Click and drag on a thermogram to change the location of the lines.
The cross section lines can be changed to be either vertical or horizontal by clicking on either the Vertical or Horizontal Orientation buttons to the bottom right.
The average temperature of each foot is graphed at the top of the page.
Usage
The usage tab graphs the average number of days per week at least one scan was taken. The number of days used in the week prior to today is shown to the right of the thermogram for the selected scan.
Asymmetry Notification Level
Each graph contains a colored bar at the top of the graph. This is known as the Notification Level, and it shows a summary of whether the temperature asymmetry over any scan in a prior period (2 weeks by default) exceeds the notification thresholds. The number of days used in determining the notification level, as well as the thresholds for what constitutes low, medium, and high asymmetry are defined and can be changed in the Settings modal. A green Notification Level bar indicates the scans are below the asymmetry notification levels (Low asymmetry). Yellow indicates that the Medium Asymmetry Threshold has been exceeded. Red indicates that the High Asymmetry Threshold level has been exceeded. These thresholds can be modified in the Settings window.

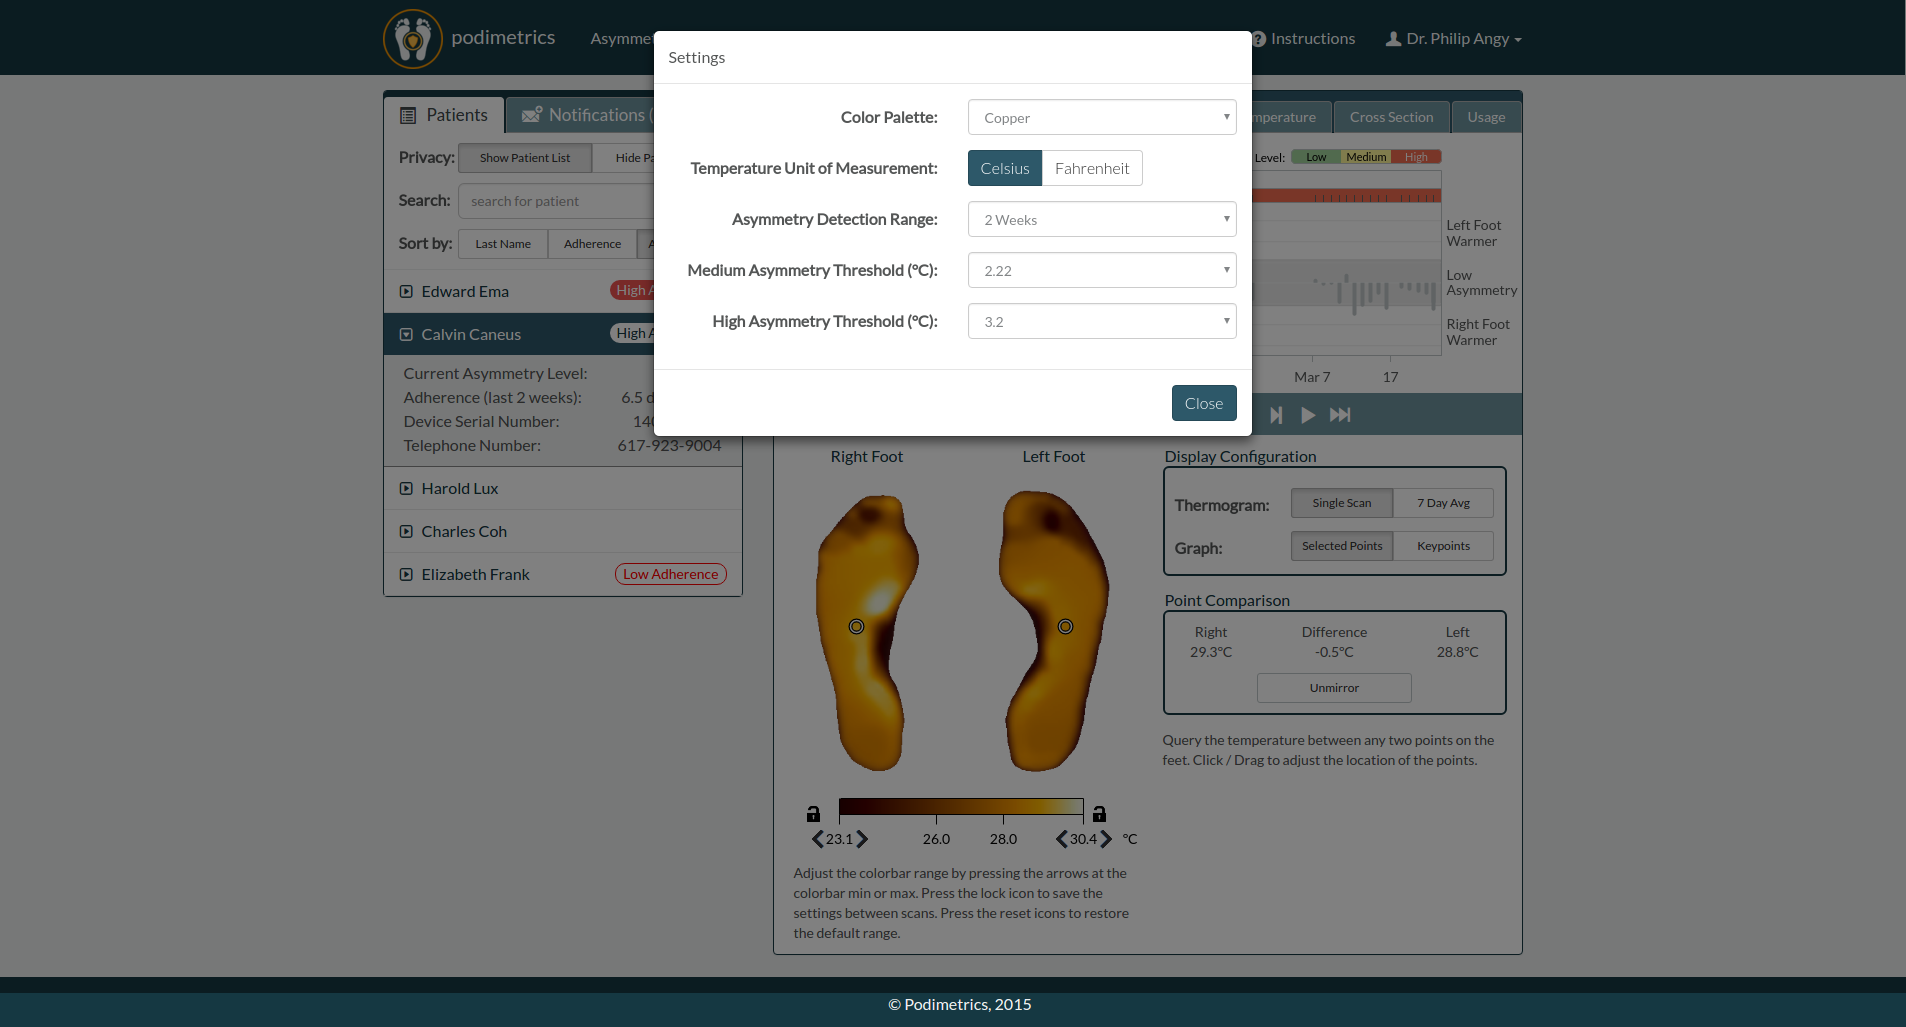
Managing Settings
You can change the settings of PADS™ by clicking the Settings tab in the navigation header bar at the top of the page (look for the icon).
You can:
- Change the color palette that is used to map thermogram colors to temperatures.
- Change the temperature units between Celsius and Fahrenheit.
- Change the Asymmetry Detection Range. This will adjust the duration that a notification level will persist even if new scans are below the threshold.
- Change the Medium Asymmetry Threshold.
- Change the High Asymmetry Threshold.
About
The Asymmetry Detection System™ is part of the Podimetrics Remote Temperature Monitoring System™ designed to be used in conjunction with the Podimetrics Mat. The Mat is used in the patient’s home and acquires thermal images from the plantar surface of their feet when the patient stands on it. The thermal data is acquired through a large sheet of flexible temperature sensors spaced apart on a 1 cm grid that conforms to the plantar surface of the foot. The data from each Mat is sent to a remote server which stores the raw data, processes it into a thermogram, and displays this thermogram on the Asymmetry Detection System™ web application for evaluation by a healthcare professional. Elevated temperature is one sign of inflammation and the thermal images presented here may be useful for monitoring the feet for signs of inflammation. The Asymmetry Detection System™ can be accessed by any internet-enabled desktop or mobile device through a web browser.
| Technical Information | |
|---|---|
| Operating Temperature Range | 15 to 40 °C (59 to 104 °F) |
| Temperature Accuracy | +/- 0.6 °C (+/- 1.0 °F) |
| Temperature Precision | +/- 0.3 °C (+/- 0.5 °F) |
| Spatial Resolution | 1cm x 1cm (0.4" x 0.4") 9,688 pixels per square meter (900 pixels per square foot) |
Warnings
- The RTM System™ does not replace routine foot care, including regular self-examination by the patient and periodic examination by a healthcare provider.
- The Asymmetry Detection System™ does not diagnose any specific disease state. It should be used under the direction of a healthcare professional and can prompt communication between a patient and healthcare professional between scheduled, routine foot examinations.
- Patients should consult a healthcare professional for details on how to interpret the foot temperature data provided by the Asymmetry Detection System™.
- Plantar foot temperature is not representative of a patient's internal body temperature, and the Asymmetry Detection System™ should not be used to evaluate fever or overall patient health.
- The Podimetrics Mat should only be used for a single patient to avoid the risk of cross-contamination and to ensure that the thermograms are interpreted correctly. Prior to using the Asymmetry Detection System™ to evaluate signs of inflammation, the user should view successive thermograms to ensure the data is indeed from the same patient.
Indications
The Podimetrics Remote Temperature Monitoring System™ (RTM System™) is intended to be used by a patient in conjunction with a healthcare professional or caretaker for periodic evaluation of the temperature over the soles of the feet for signs of inflammation. It will provide information indicating when the patient and healthcare provider should communicate for further evaluation and treatment regarding any persistent localized inflammation observed on the feet via the electronic sensing system and remote visualization of its data. The Podimetrics RTM System™ is intended to be used under the direction of a healthcare professional as an adjunct to, and not in replacement of, self-examination and periodic foot care and examination conducted by a healthcare professional and does not diagnose any specific disease state.
Requirements
Podimetrics supports and tests the Asymmetry Detection System™ on the following web browsers:
- Android Browser 2.3+
- Chrome 118.0.5993.54
- Chrome for Android 117.0.5938.140
- Firefox 118.0.1
- Internet Explorer 11
- IOS Chrome 119.0.6045.5
- IOS Safari 16.5
- Microsoft Edge 117.0.2045.55
- Mobile Chrome 117.0.5938.149
- Opera 102.0.4871.0
- Opera Mini 73.0.2254.68338
- Safari 16.5
Please contact Podimetrics in the event that you find an issue with the Asymmetry Detection System™ in one of these supported browsers.
The Asymmetry Detection System™ requires that the user enable Javascript and cookies on his/her browser. Instructions for enabling Javascript can be found at:
Instructions for enabling cookies can be found at:
- Internet Explorer 11 (scroll down to "Allow cookies")
- Firefox 38
- Chrome 43